
Industrial solar PV
Solar PV systems at industrial scale
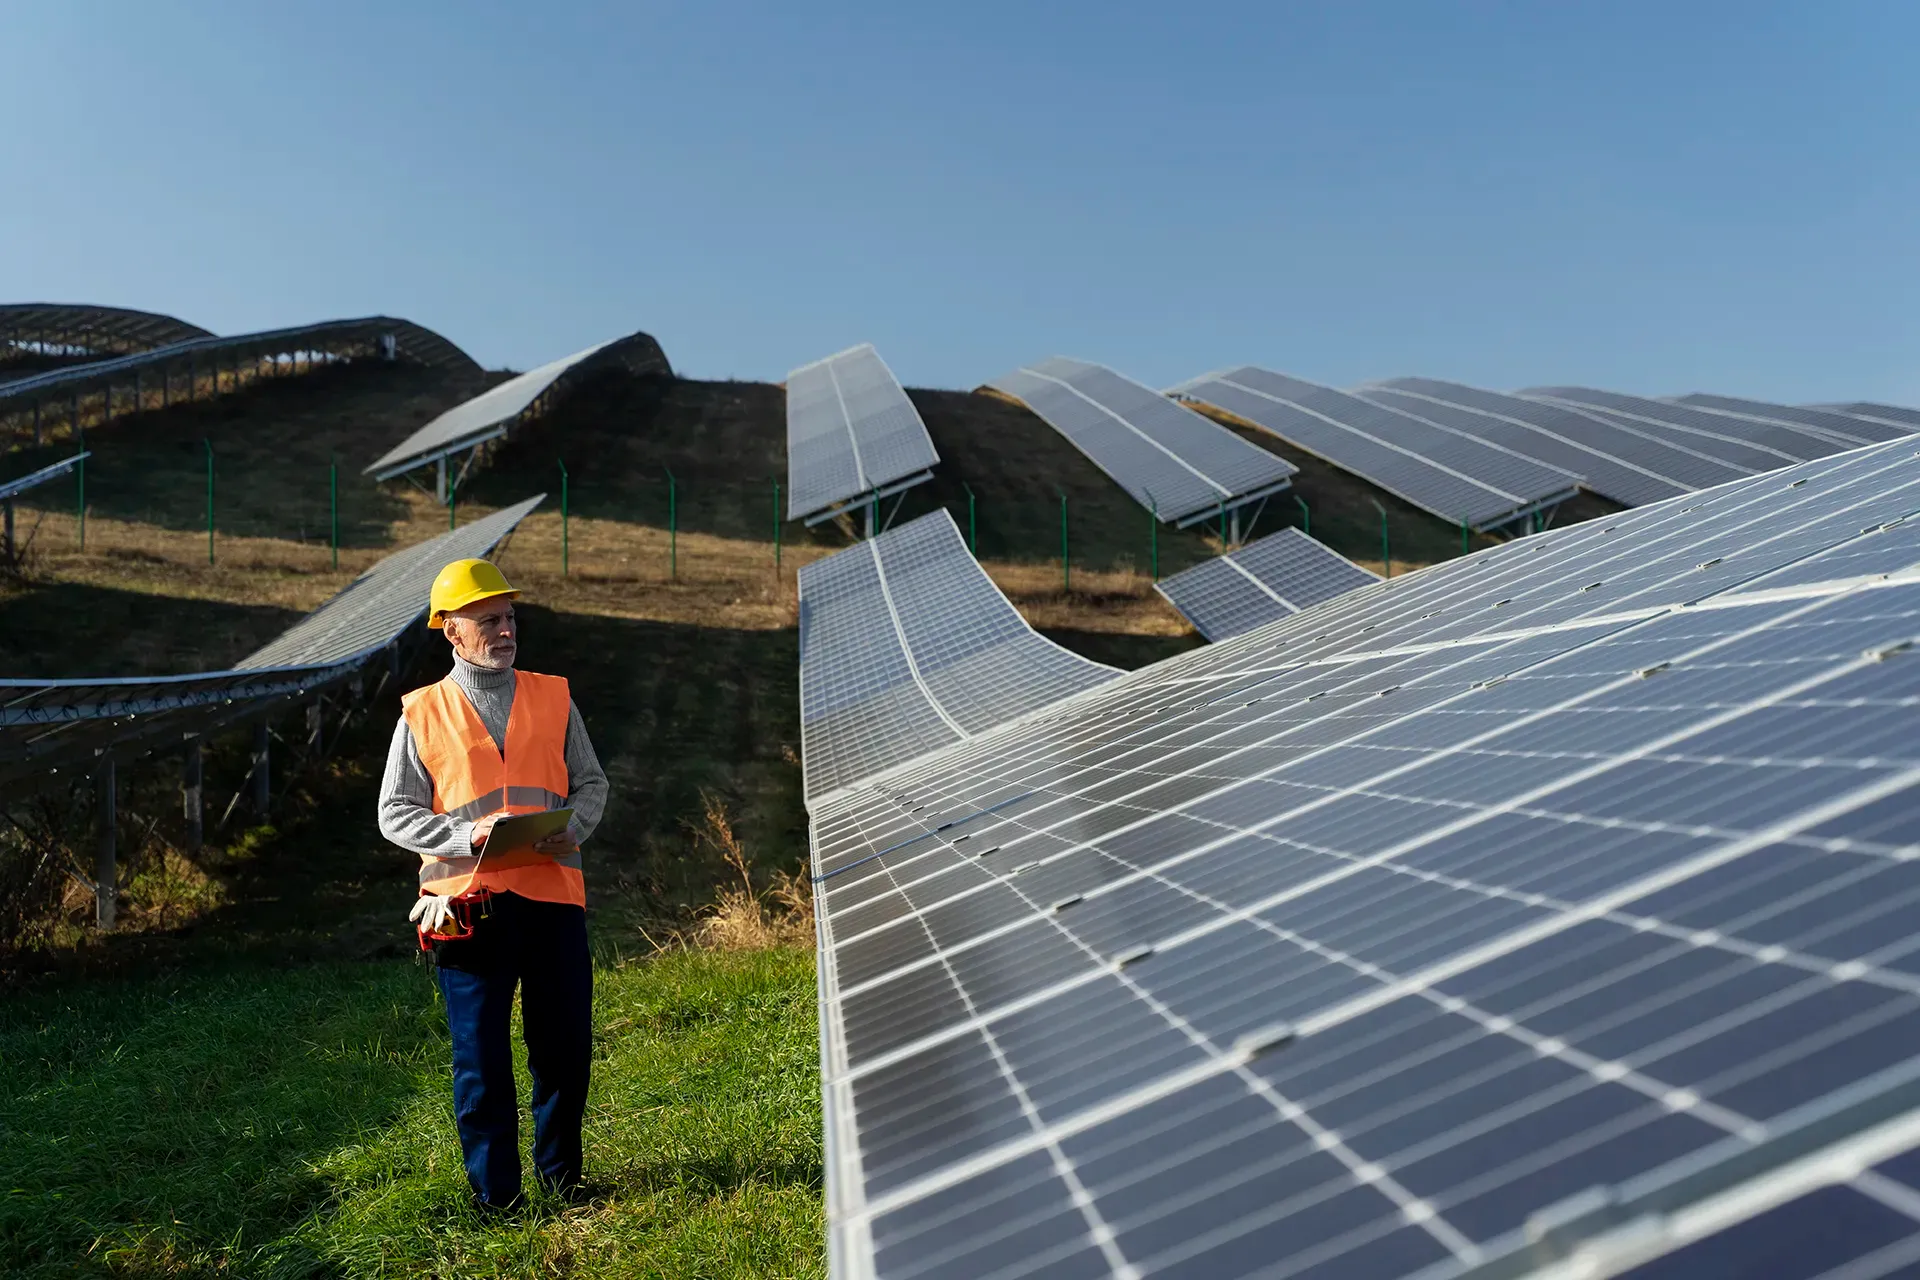
From 50 kWp to several MWp. Roof- or ground-mounted industrial solar PV systems optimised for self-consumption — with turnkey delivery, from design to commissioning.
Benefits
Why solar PV is the best investment in the industrial sector
3–6 years
Payback
Industrial solar PV is the energy investment with the shortest payback. It is even better for fixed-price clients: it displaces the expensive flat rate during the solar hours.
25+ years
Lifetime
The performance warranty on the modules is 25–30 years. After payback, the plant generates practically free energy for 20+ years.
Zero
Without capital investment
In the Energy Infrastructure as a Service model we provide the funding — you pay from the savings, and the service fee is always lower.
Contract type and savings
Your savings depend on your contract type
The value of solar PV differs considerably between a fixed-price and a spot-price contract. ICP optimises separately for both.
Fixed-price contract
Solar PV displaces the expensive, flat fixed rate during the sunny hours — which are precisely the cheapest generation hours. This delivers the largest saving per kWh, because the fixed rate also contains the supplier’s risk premium. Typical payback: 3–4 years.
Spot (HUPX) contract — DAMDay-ahead market: the HUPX next-day market, the settlement basis for spot contracts.More in the glossary →
Solar PV displaces the midday (cheapest) spot price — a lower saving per kWh in each interval, but still substantial given the total volume. It becomes stronger combined with battery storage: the two assets compensate for each other’s weaknesses. Typical payback: 5–6 years.
Energy prices in context
Solar savings = avoided energy cost
The industrial electricity price consists of two components: the energy fee (the commercial rate, which may be fixed or spot) and the system usage charge (regulated, dependent on voltage level, identical for fixed and spot contracts).
When the solar system generates and the site consumes the entire output (self-consumption), both components are avoided — not only the energy fee but also the consumption-based system usage charge (per kWh). For medium-voltage industrial clients this alone is around 12 HUF/kWh of additional saving.
This is why the actual saving from solar PV is higher than the energy fee alone would suggest.
System usage charges — interactive data →Energy fee
The commercial rate: fixed price or HUPX-indexed spot. The contract type determines what each generated kWh is worth.
System usage charge — contracted capacityThe maximum kW contracted at the connection point, carrying a fixed annual capacity charge.More in the glossary →
Regulated and dependent on voltage level. Every self-consumed kWh avoids this as well.
System types
From 50 kWp to several MWp
Flat roof
Industrial halls, warehouses, logistics centres. Ballasted or mechanically fixed mounting. East–west layout to level out generation and reduce reverse power flow. Typical size: 100 kWp – 2 MWp.
Pitched roof (tiled, trapezoidal sheet)
Rail-mounted system without penetrating the roof skin (clamp or membrane fixing). Tilt and orientation are given by the roof — we account for this in the simulation. Typical size: 50 kWp – 500 kWp.
Ground-mounted system
Pile-driven mounting structure, south orientation, at the optimal tilt (around 30–35° in Hungary). Larger system sizes and easier expansion. Typical size: 200 kWp – 5 MWp.
Design
Simulation-based sizing
Most solar proposals are produced from simple templates: “X kWp of roof area = Y kWh of annual generation.” That is not enough. The value of an industrial system lies not in generation but in the self-consumption ratio — how much of the output the site actually uses, and how much has to be clipped or handled as reverse power flow.
ICP’s own simulation engine works at quarter-hourly resolution with PVGIS irradiation data (an 89-point grid across Hungary), and compares generation against the real consumption profile — interval by interval.
The result: you know exactly at which system size self-consumption is optimal, where clipping begins, and what effect adding battery storage would have.
Self-consumption ratio — self-consumption ratioThe share of solar generation used on site; typically 80–95% at industrial plants.More in the glossary →
The share of generation used on site — the real measure of an industrial system’s value.
Clipping — clippingDC generation above the inverter AC rating that cannot be used — capturable with a BESS.More in the glossary →
DC generation above the inverter’s AC rating that cannot be used. Capturable with battery storage.
Our simulation output includes
- •Annual generation (kWh) and specific yield (kWh/kWp)
- •Self-consumption ratio and the extent of clipping
- •Savings by contract type (fixed/spot)
- •Monthly breakdown: generation, consumption, self-consumption, grid offtake
- •Payback period and 25-year cash flow
- •CO₂ savings (tonnes/year)
- •The effect of adding battery storage (optional)
Financing
Financing options
Own investment (EPC)
Turnkey installation, becoming your property. The shortest payback and the highest long-term return.
Jedlik + tax incentive
Under the Jedlik programme, solar PV is supported as a complementary activity alongside battery storage (max. 33%). Combined with storage, substantial support can be obtained.
Jedlik details →Zero investment (service)
Energy Infrastructure as a Service: we fund and install, you subscribe. The service fee is always lower than the savings — the difference is yours from day one.
EIaaS details →How much solar can your roof carry?
Send us your consumption data and the site layout — based on our simulation we will tell you the optimal system size and the payback you can expect.